
Server Health & Process Manager
See what is happening on your server — live.
Bring server load, CPU, memory, processes, PHP workers and hosting-account usage into one view. Understand where pressure is coming from before taking action.
Swipe to inspect · tap the image for full context
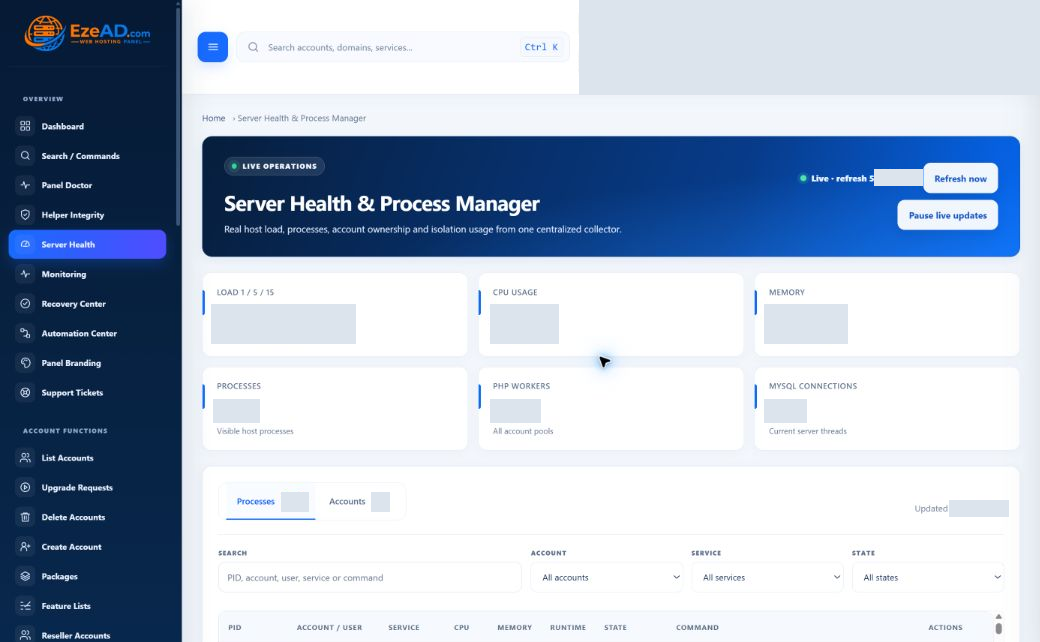
The live server picture
Understand the server at a glance.
Start with the signal that matters. The overview brings six operating measurements together, with the latest collection time close at hand.
Load average
Read the 1, 5 and 15-minute averages to distinguish a spike from sustained pressure.
CPU usage
See how busy the host is across its available cores.
Memory
Review used memory in the context of total host memory.
Processes
See the population of visible processes before narrowing the investigation.
PHP workers
Understand PHP concurrency across hosting-account pools.
MySQL connections
Review database thread activity alongside the rest of the server.
Process Manager
Find the work consuming your resources.
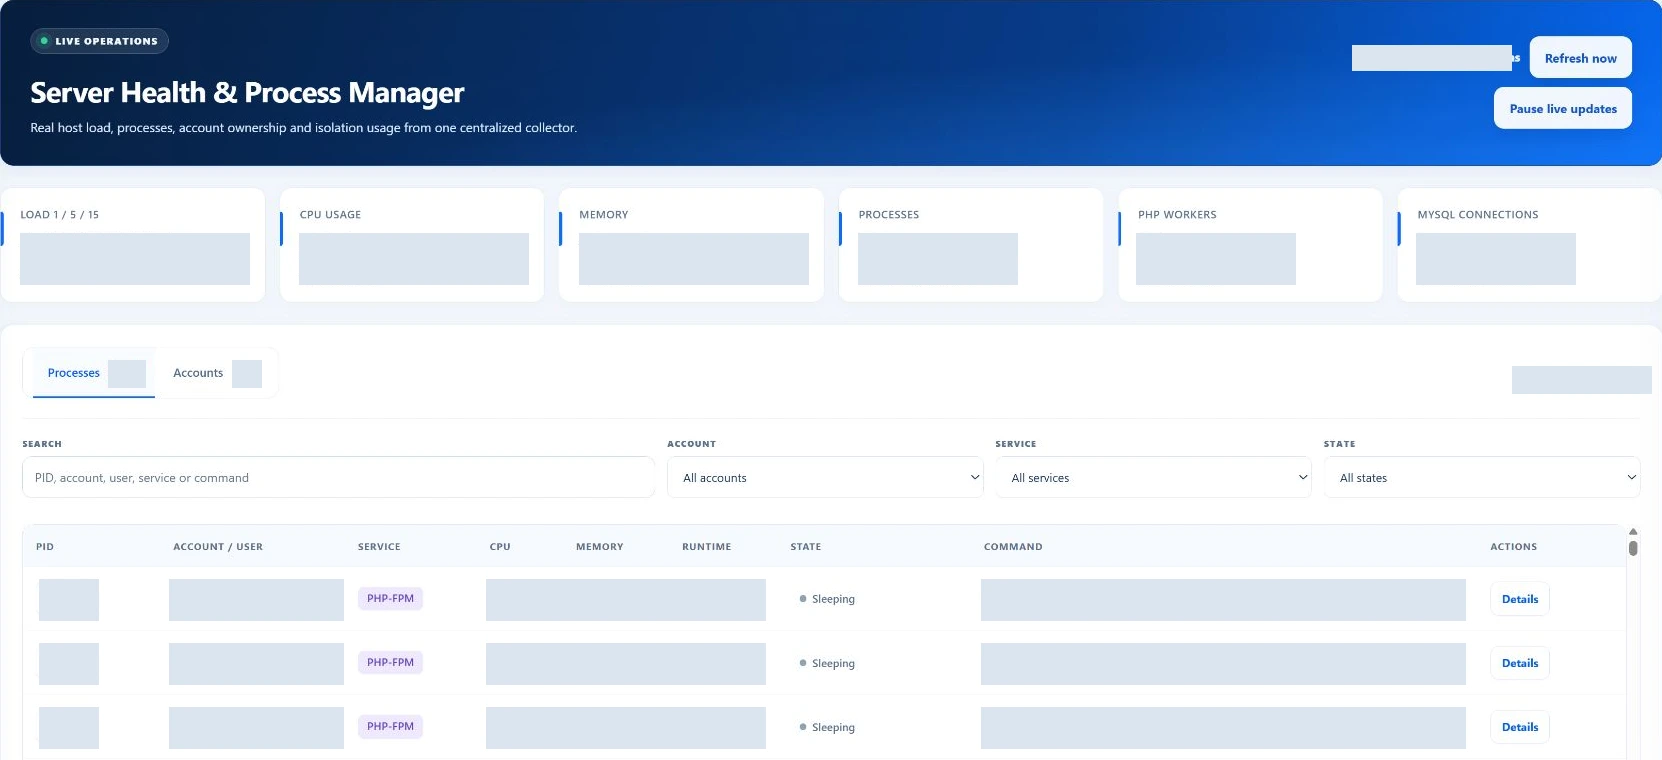
Search by PID, account, Linux user, service or command. Filter the process list, sort the resource you are investigating, then open the details before deciding what to do.
From a busy server to a specific process
- Identify
- PID · account / user · service · command
- Compare
- CPU · resident memory · runtime · state
- Inspect
- Linux identity · systemd unit · control group
Root administrators can signal eligible account processes after confirmation. Protected system processes remain outside these controls.
Swipe to inspect · tap the image for full context
Hosting-account resource view
Usage makes more sense beside an allowance.
Switch to Accounts to compare consumption with effective limits. Follow the account, monitoring or policy link when the next step belongs in a different workspace.
Swipe to inspect · tap the image for full context
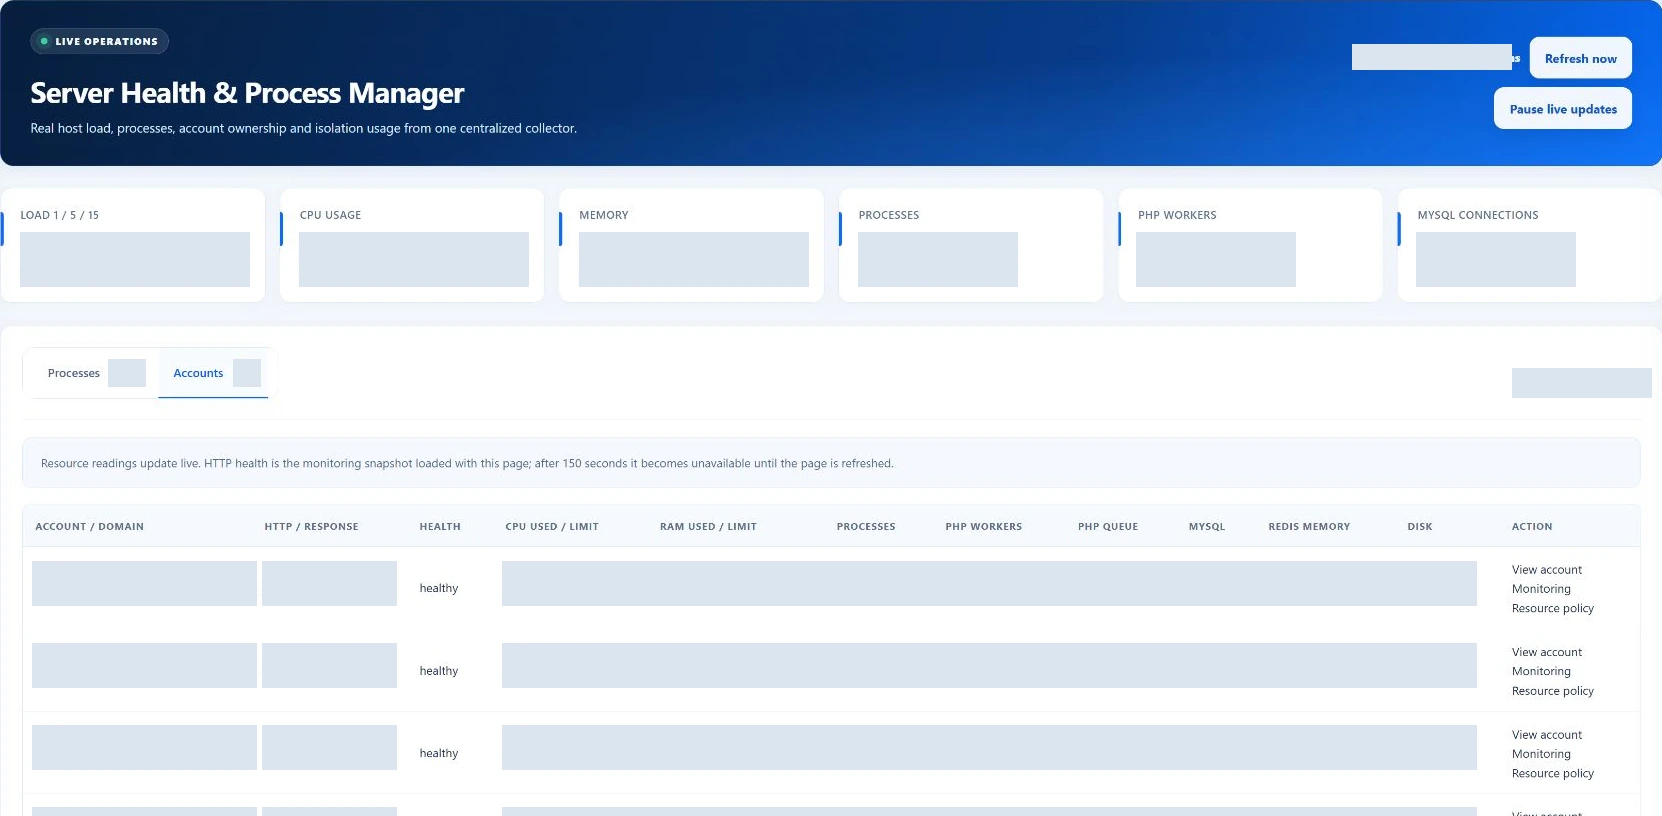
Visibility and resource control belong together.
Observe the demand, understand the account, then adjust policy deliberately.
An everyday operating scenario
When the server feels slow, start with evidence.
An investigation sequence—not an automatic action or a simulated incident.
Notice pressure
Check the latest host observation.
Narrow the work
Find a high-resource process.
Check the account
Compare usage with its effective policy.
Choose a response
Investigate the application or make an authorized change.
Look again
Review the process and service afterward.
Connected operating views
Follow a resource question into service health.
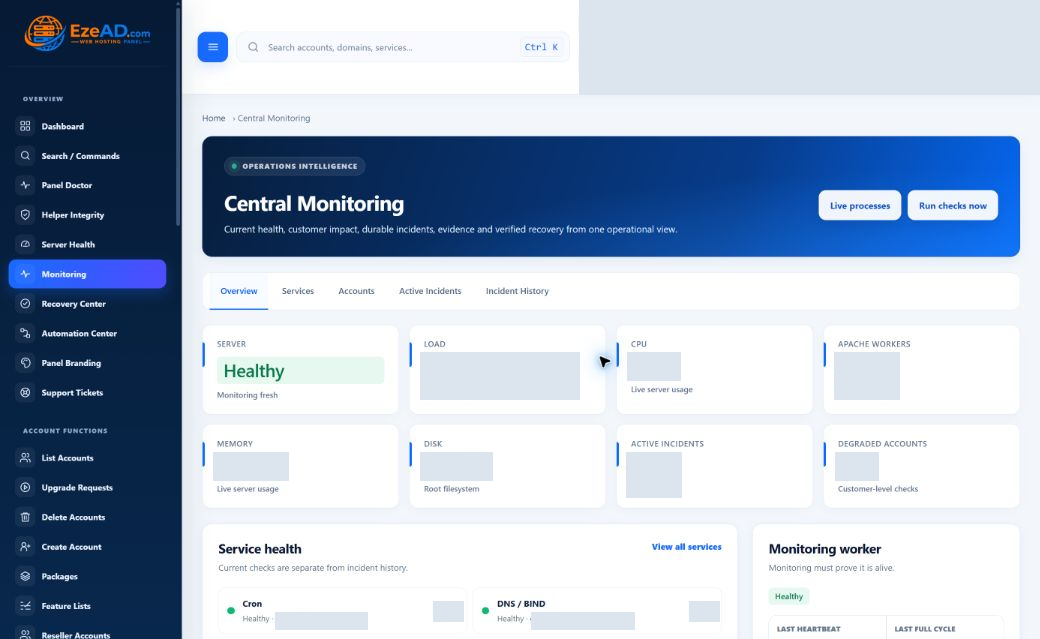
Server Health helps you investigate demand. Central Monitoring connects supported checks to service state, account impact and incident history.
Data freshness, in view
Collection timestamps distinguish fresh readings from old observations. Resource updates and account HTTP evidence have separate refresh paths.
Read the technical guide →Swipe to inspect · tap the image for full context
A little more detail
Good questions. Clear answers.
The practical details behind the product.
What does Server Health monitor?
The overview shows load averages, CPU, memory, process count, PHP workers and MySQL connections. Process details and the Accounts view add ownership, usage, effective limits, disk and available HTTP context.
How often is data updated?
The open, visible page requests the latest collector snapshot every five seconds unless updates are paused. The collector records its own timestamp. Account HTTP evidence is loaded separately with the page and becomes unavailable when it is too old; it is not refreshed by every resource poll.
Can I see which account is consuming resources?
Managed processes are mapped to hosting-account identities where available. The Accounts view compares supported resource usage with effective limits and links to account and monitoring tools. Unmapped system processes remain separate.
Does Server Health automatically stop processes?
No. It is an investigation workspace. Eligible process termination requires a root administrator and backend identity checks; force kill requires explicit confirmation. Protected system processes cannot be stopped from this interface.
How does it connect to Resource Isolation?
Server Health shows consumption. Resource Isolation defines the effective allowance. Compare the two before changing account policy, then check the workload again. Resource limits are not adjusted automatically by Server Health.
One connected hosting platform