
Server Health & Process Manager
Find the workload behind the pressure.
Move from host load to the account and process behind it. Compare observed use with policy, inspect the process identity, and understand the consequence before considering an action.
Find the workload behind pressure before interrupting customer work.
Swipe to inspect · tap the image for full context
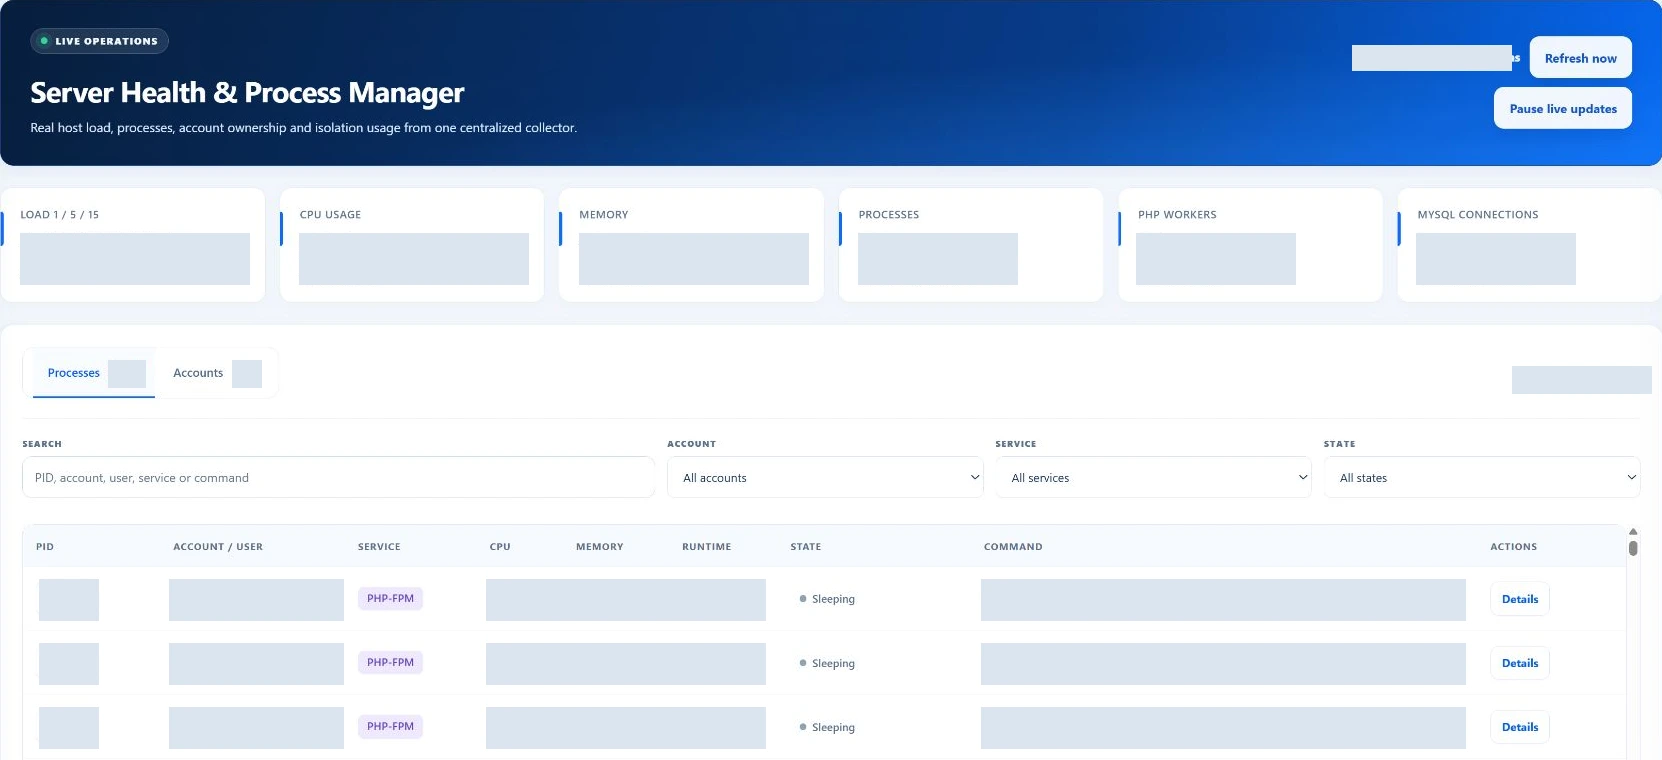
- Host pressure
- Account impact
- Process identity
- Verified response
Read the host before narrowing the scope
Six signals establish the operating context.
Load 1 / 5 / 15
Compare short and longer load averages with CPU-core context. Load is not the same measurement as CPU utilization.
CPU usage
Host CPU utilization across cores helps establish whether the pressure is shared or concentrated in a smaller workload.
Memory
Read used memory against the host total. A process’s resident memory and an account’s total memory policy are different scopes.
Processes
The visible host-process count provides context for the process table. It includes more than customer PHP workers.
PHP workers
The summary counts workers across account pools. Use account detail before attributing the total to one customer.
MySQL connections
Current server threads describe shared database activity. Compare account-level evidence before changing a connection allowance.
Two sources of evidence
Not every reading has the same clock.
Resource and process snapshots
A centralized collector gathers host evidence. The browser reads its cache, normally refreshing every five seconds while the page is visible and live updates are not paused. Refresh now requests the available snapshot; it does not launch a fresh host scan.
Pause live updates freezes the view for inspection. Resume before treating the display as current. An unavailable or stale collector produces an error rather than valid-looking zero measurements.
Account HTTP health
The account HTTP status and response time come from the monitoring snapshot loaded with the page. They do not update with every resource poll. In the current implementation, that evidence becomes unavailable after 150 seconds until the page is refreshed.
Check the Updated time, live/paused state and the owning Monitoring view together. A fresh CPU reading does not make an older HTTP result fresh.
From symptom to identity
Investigate before you interrupt.
Start with the host summary
Identify the kind of pressure you are investigating: load, memory, process volume, PHP concurrency or database connections. A high value starts a question; it is not by itself a reason to terminate a process.
Narrow the process table
Search by PID, account, Linux user, service or command. Filter by account, service and state. Sort the relevant column to compare CPU, memory, runtime or identity instead of scanning an unfiltered list.
Open the process details
Review the hosting account, Linux user and UID, process state, CPU, memory, runtime, systemd unit and control group. Confirm the process belongs to the workload you intended to investigate.
Connect the customer and policy
Switch to Accounts for used-versus-limit context. Follow View account, Monitoring or Resource policy when the next question belongs to account configuration, incident evidence or effective limits.
Verify any action separately
If an authorized action is justified, read its confirmation and result, then refresh the evidence. Signal acceptance is not proof that an application recovered or that the original cause has been fixed.
The account view
Compare consumption with the relevant limit.
Account rows bring identity, HTTP evidence, health and resource use together. Use the effective values shown rather than assuming every customer has the package’s original defaults.
- CPU and RAM
- Compare used CPU and memory with the account allowance. Account memory may use control-group evidence when available; it is not interchangeable with a single process’s resident-memory column.
- Processes and PHP workers
- Process allowance covers a different population from PHP concurrency. Read both before deciding whether the issue is too many requests, an unrelated account task or a broader policy limit.
- PHP queue
- Queue use and capacity describe waiting work. A worker count alone cannot explain whether requests are backing up.
- MySQL, Redis and disk
- Review database connections, cache memory and disk usage within their own units. Missing telemetry remains unavailable; the page does not infer a value to fill a gap.
Connect the process to its account allowance.
Compare observed usage with the account’s effective policy before choosing an intervention.
Swipe to inspect · tap the image for full context
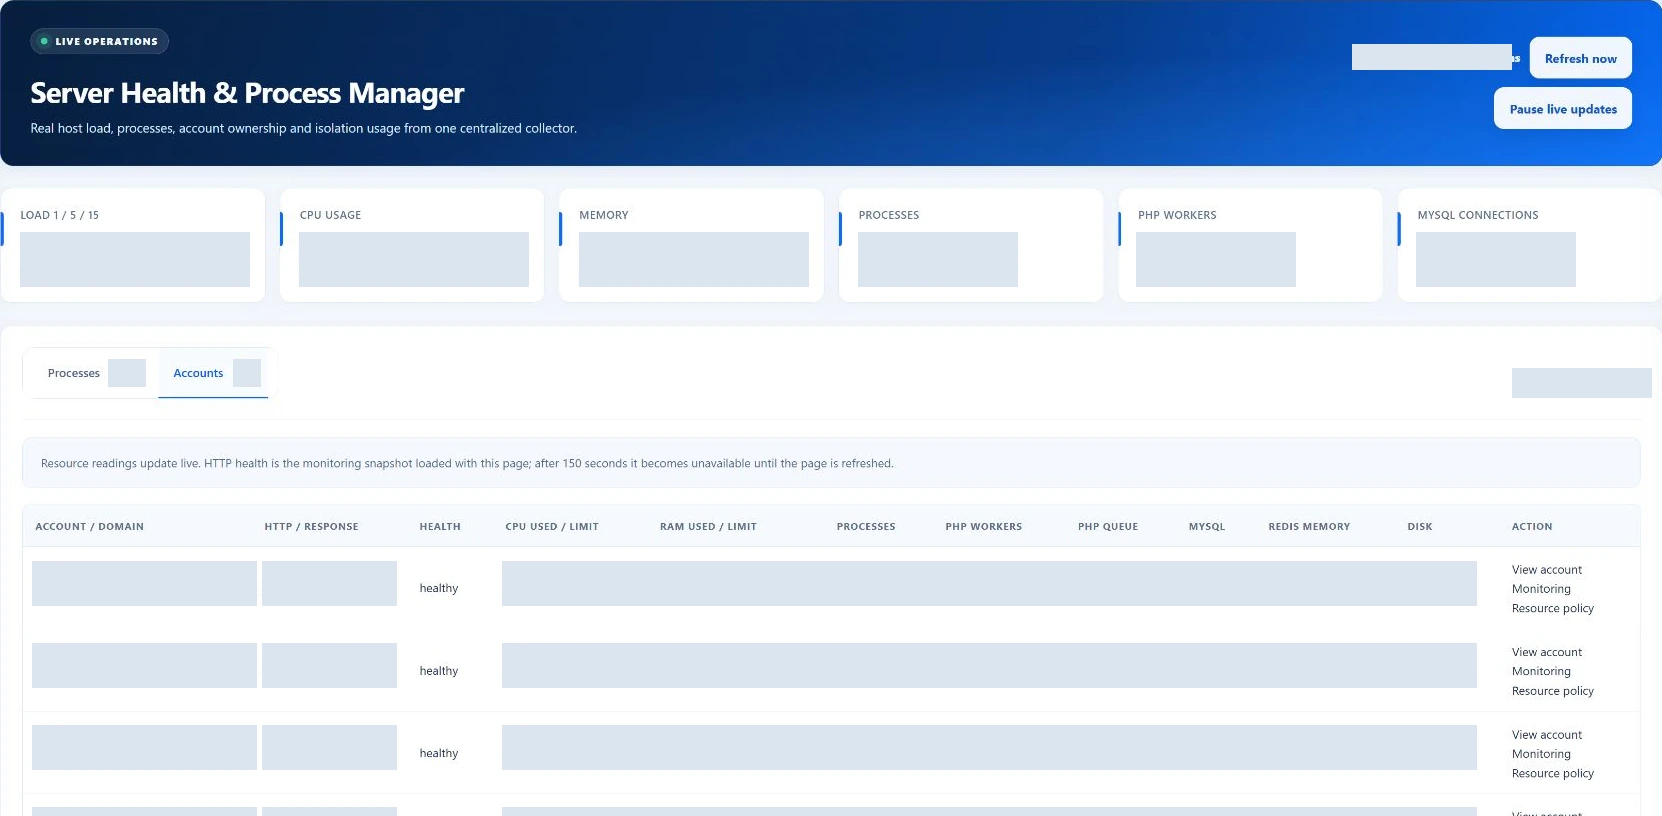
Root-only controls with consequences
Terminate and force kill are not equivalent.
Terminate · SIGTERM
Requests that the verified account process terminate, allowing it to handle the signal and clean up. A process may not exit immediately; check the subsequent state rather than repeatedly submitting the action.
Force kill · SIGKILL
Stops the selected process without normal cleanup. The interface requires typed confirmation matching its PID. This can interrupt work and leave application operations incomplete.
Read empty and error states correctly
Unavailable is not idle.
- No matching processes
- Your filters may exclude all rows. Clear a filter or inspect the next snapshot; this does not mean the server has no running processes.
- No mapped accounts
- The collector has not supplied active managed Linux identities. This is different from a zero-resource account.
- Collector unavailable
- Missing, invalid or stale snapshots cannot support a live reading. Metric and process displays are cleared rather than preserved as if fresh.
- Protected / read-only
- Details can remain visible even when controls are not permitted. Root status alone does not make protected system processes manageable from this page.
Frequently asked questions
Does Pause stop the server collector?
No. It pauses the browser’s live updates for inspection, not the host’s collection or customer workloads.
Does Refresh now update account HTTP evidence too?
The resource refresh reads the latest collector snapshot. Account HTTP evidence is loaded with the page; refresh the page or consult Monitoring for newer HTTP context.
Can every administrator stop processes?
No. Process signalling requires root-administrator authority, and only eligible managed-account processes pass the server-side target checks.
Is a sent signal proof that the issue is fixed?
No. Inspect the process and application afterward, then use Monitoring to check current service/account health.
Should I increase the package limit when usage is high?
First establish the workload, effective policy and available capacity. Server Health provides evidence; it does not decide whether the application, package or host needs to change.