
Process Manager
See exactly what is running on your hosting server.
EzePanel connects current process activity with CPU, memory, runtime and hosting-account context so administrators can investigate server pressure without starting from raw shell output.
Swipe to inspect · tap the image for full context
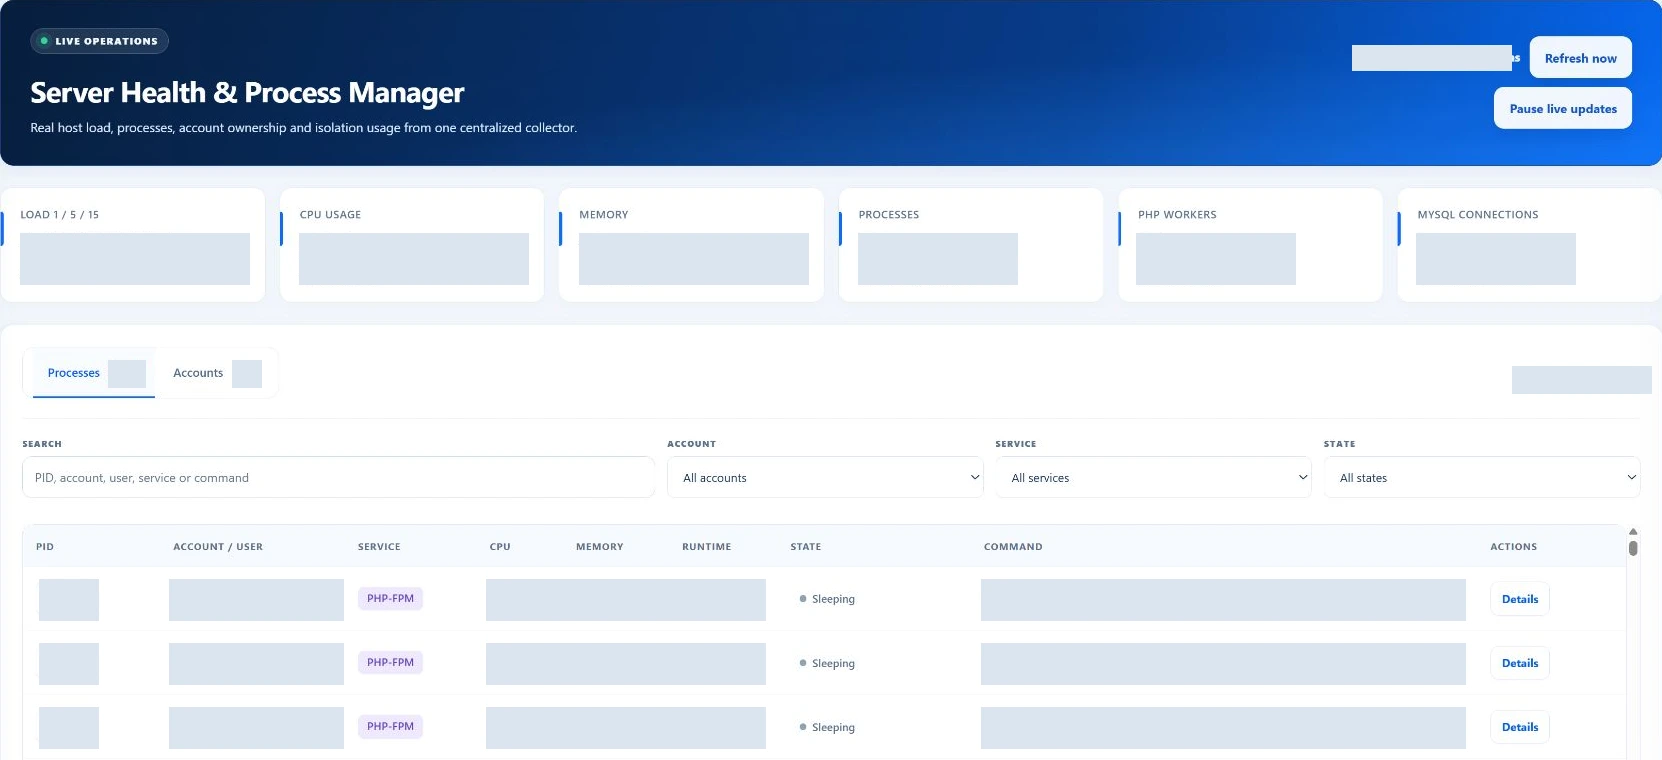
From load to workload
Server load tells you there is pressure. Process Manager helps show where it comes from.
Follow the activity behind a busy server. Where attribution is available, the process connects to a Linux identity and the hosting account responsible for the workload.
What you can see
Read the workload, one field at a time.
The process table keeps identity, resource use and runtime together. Open a row’s details when you need the surrounding service context.
- PID
- Process identity
- Process / command
- What is running
- Account / user
- Who owns it
- CPU
- Processing demand
- Memory
- Resident usage
- Runtime
- Elapsed time
- State
- Current process state
Inside Server Health
Investigate active workloads without leaving the panel.
Sort the collected processes to find CPU-heavy or memory-heavy work. Narrow the list by account, service or state, then inspect the command and elapsed runtime.
Keep the view moving during an incident, or pause the snapshot while you inspect it. Refresh when you are ready for a new reading.
Explore the Process GuideFind the process
Search the PID, account, user, service, command or unit.
Narrow the view
Use account, service and process-state filters.
Inspect the context
Open details for ownership, resources and available unit information.
Control the reading
Pause live updates without stopping the workload.
Account context
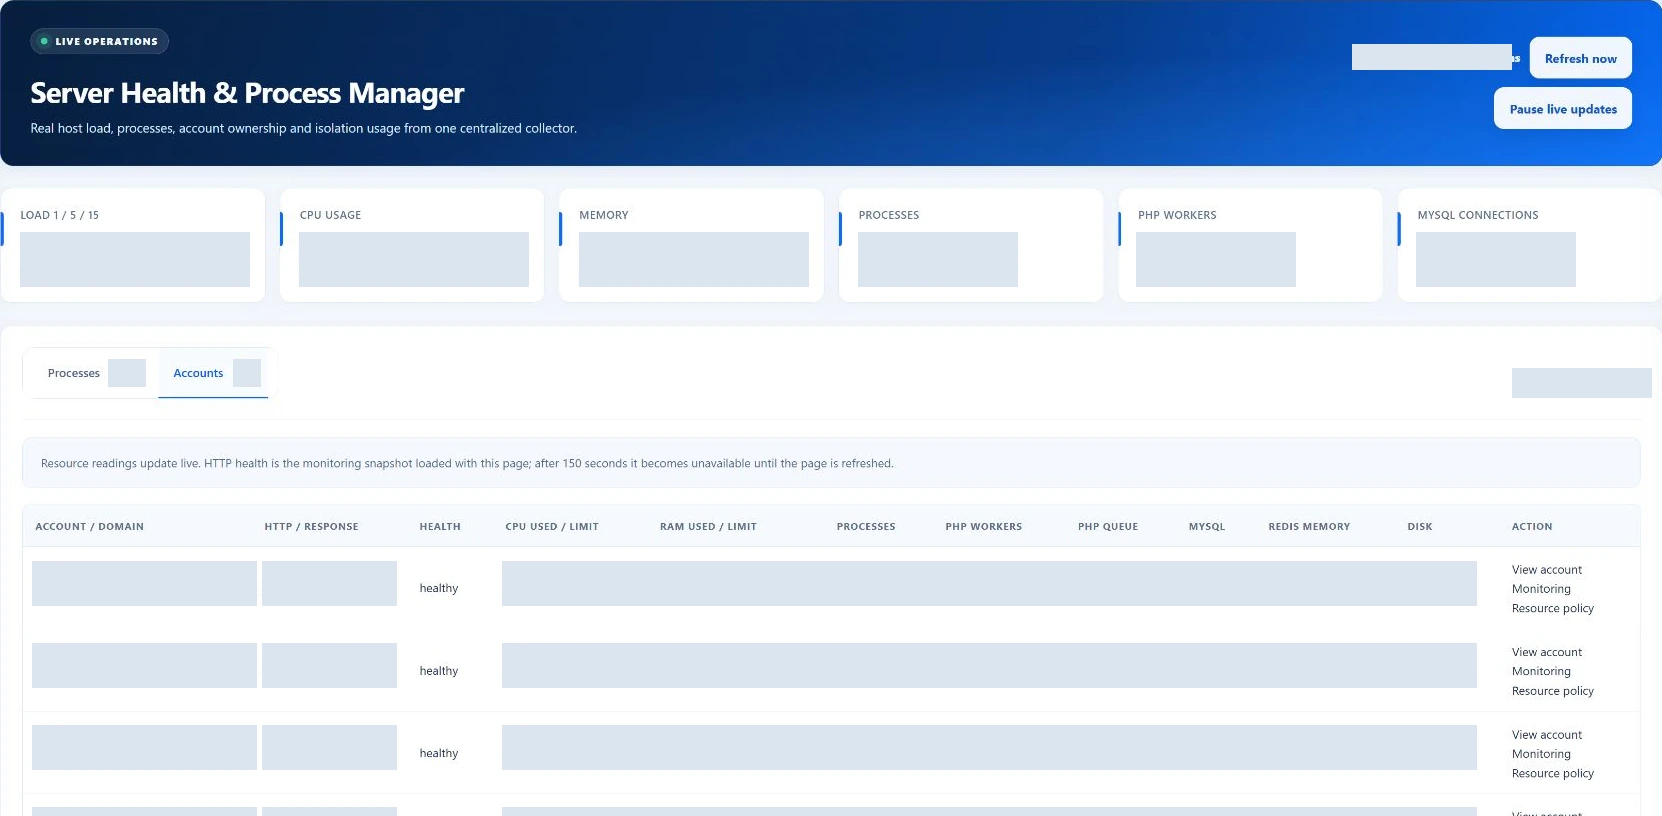
A process means more when you know who owns it.
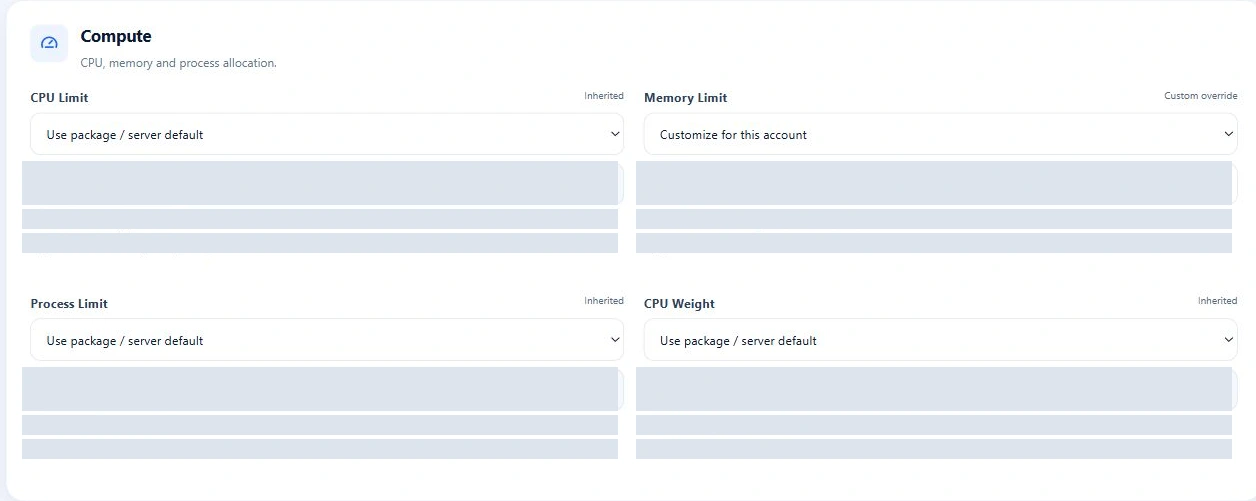
Move from the process to the account, then compare observed demand with the effective resource policy. CPU, memory, process and PHP-worker allowances help put the workload in context.
Swipe to inspect · tap the image for full context
An operating example
A server becomes slow. Where do you start?
An illustrative investigation: use each view to narrow the next question before deciding whether the workload needs intervention.
Load rises
Confirm the pressure in Server Health.
Find the workload
Open Processes and sort by resource use.
Identify ownership
Follow the associated account when available.
Compare the policy
Review current demand against its allowance.
Choose the action
Investigate, adjust or use an eligible process control.
Product gallery
Explore the connected workspaces.
Compare the workload above with the account’s CPU, memory and process policy.
Swipe to inspect · tap the image for full context
Technical details
Process actions need the right identity.
A numeric PID alone is not enough: a process may exit or restart between inspection and action.
Identity before a process action
Processes can exit and PIDs can be reused. EzePanel checks the selected process against additional start/runtime identity before an eligible signal, rather than trusting the PID alone. Review the refreshed state after acting.
Protected processes and explicit controls
Root administrators can request graceful SIGTERM termination or explicitly confirmed SIGKILL for eligible hosting-account processes. System and protected service processes are outside these controls. Investigation remains separate from the decision to act.
Reading a snapshot
CPU, resident memory and elapsed runtime describe the collected workload. Pausing preserves a snapshot; it does not stop the process. Account HTTP evidence has its own collection and freshness rules, separate from the process refresh cycle.
Frequently asked questions
Good questions. Clear answers.
What does Process Manager show?
The Processes view in Server Health shows PID, Linux user and hosting-account attribution where available, service, CPU, resident memory, runtime, state and command. A detail view adds context such as the systemd unit and control group when available.
Can I see which hosting account owns a process?
Yes, where EzePanel can associate the process with a managed hosting account. System processes and workloads without a matching account remain distinguishable; account attribution is not available for every process.
Does Process Manager automatically kill high-CPU processes?
No. High CPU is evidence to investigate, not an automatic termination instruction. Root administrators can signal eligible account processes through explicit controls; protected and system processes are excluded.
How is Process Manager different from Server Health?
Server Health provides the host summary and account resource view. Process Manager is its detailed Processes workspace, helping you move from aggregate pressure to the individual workloads behind it.
Can I see PHP-FPM processes?
Yes. PHP-FPM workloads appear in the collected process list. Service and account filters help narrow the view, and process details provide available ownership and runtime context.
Can I see system processes?
Yes. System processes provide useful context alongside account workloads. Visibility does not grant permission to terminate them: the panel protects system and critical service processes.
How current is process data?
While the page is visible and live updates are unpaused, it requests a resource snapshot about every five seconds. Collection and caching can affect freshness. You can pause or refresh the view; collector failures are shown as unavailable data.
Explore the platform