
User Panel · Dashboard & Resource Center
Your hosting account,
in context.
Start with your websites and everyday tools. Open Resource Center when you need to understand the storage, runtime usage and limits behind your hosting account.
Understand account resourcesSwipe to inspect · tap the image for full context
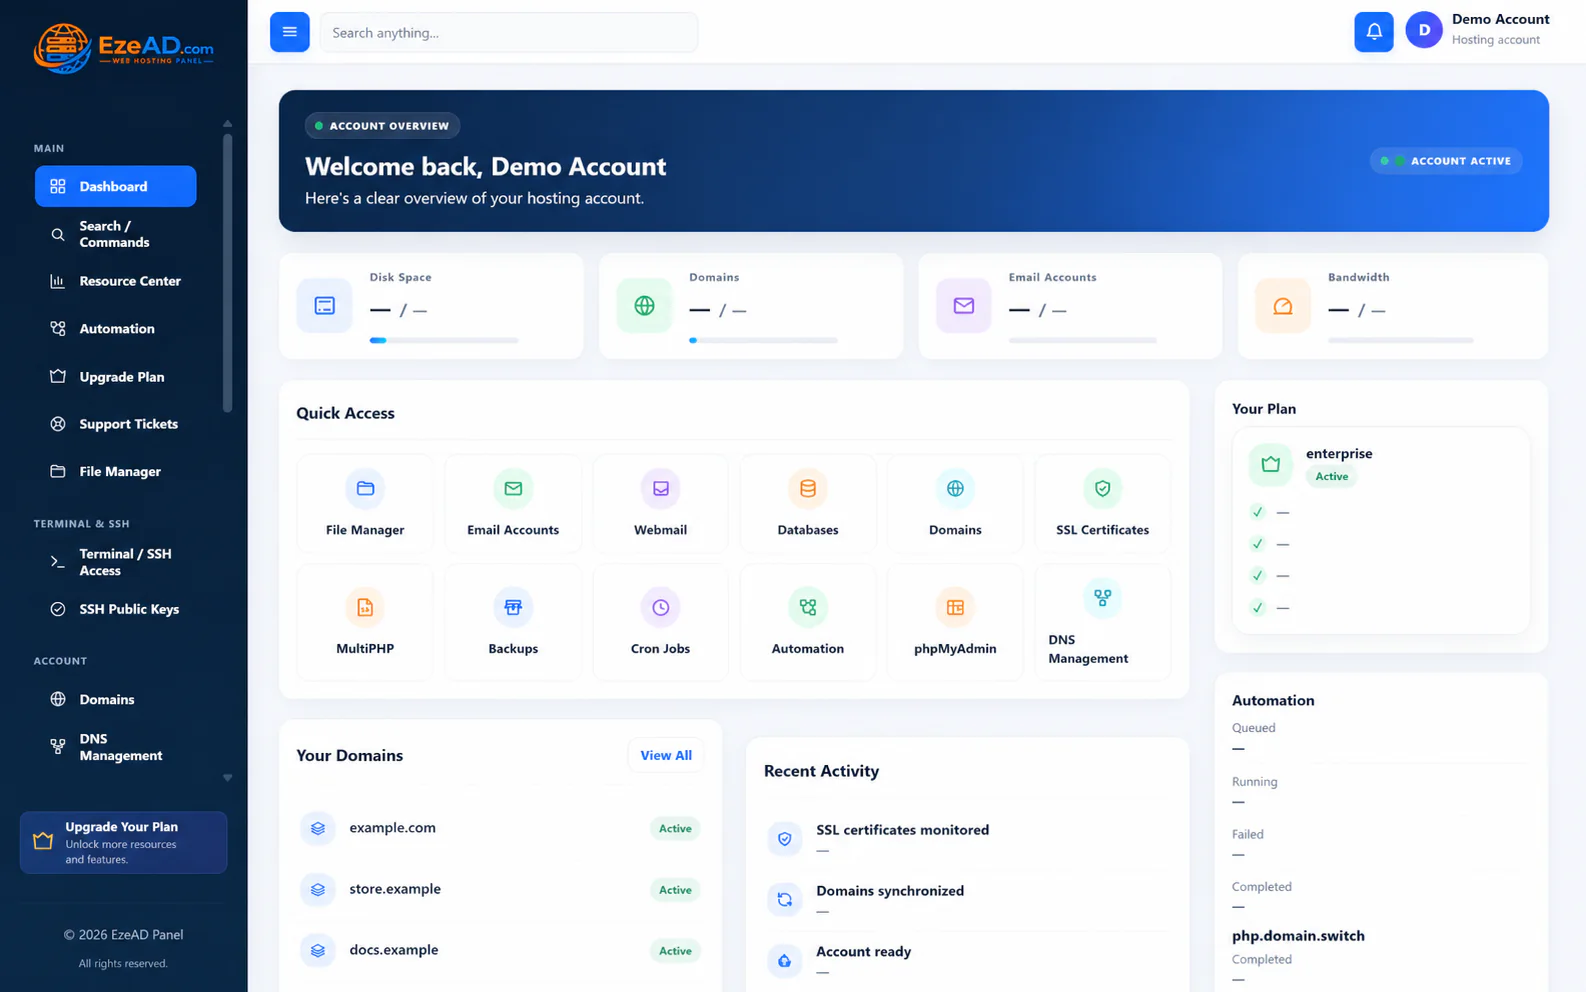
After sign-in
Start with the task in front of you.
The dashboard brings everyday hosting tools alongside account summaries. Find the website or service you want to work on, then open its dedicated workspace.
Find the website
Review the account’s primary and additional domains. Move into domain management when routing or website configuration needs attention.
Work on its content
Open File Manager to inspect the relevant document root, upload content or follow a file operation.
Manage everyday services
Use the hosting tools for mailboxes, databases and application settings. Each workspace has its own controls and access rules.
Follow recent work
Recent automation entries show account jobs and their recorded state. Open the owning workflow to understand a pending or failed task.
Resource Center
Read each resource in its own units.
Account readings and assigned limits answer different questions. Use the value, unit and allowance together before deciding that an application needs more capacity.
- CPU time
- Seconds used since the account slice started, alongside its configured core allowance. This is accumulated work, not a live CPU percentage.
- Memory and processes
- Current account memory and process counts appear with their limits. Near-limit readings help focus the next investigation.
- PHP workers
- Active workers are shown against the account’s worker allowance. Compare a busy application with its PHP settings and the time its requests take.
- Disk I/O
- The cumulative amount read and written is separate from configured read/write rates. A total in bytes does not mean the account is currently transferring at that rate.
- Database and cache
- MySQL connection counts appear against their allowance. Redis reports running state and memory where the account cache is available.
- Storage and assigned tools
- Disk space, bandwidth, inodes and counts for domains, mailboxes, databases, FTP and cron describe different kinds of consumption. Review the relevant allowance.
Readings depend on the available collectors and runtime state. A missing reading or fallback zero should not be treated as proof that the application used no resources.
Examples of investigation
A useful signal leads to a specific next step.
Storage is filling up
Inspect the files and archives that belong to the account. Preserve needed recovery copies before removing content, and consider inode use as well as file size.
Open the file-management overview →The application feels busy
Compare memory, PHP workers and database connections with their assigned limits. Give the provider the affected website, time and symptom instead of assuming that one number explains the slowdown.
Understand PHP configuration →A task has not finished
Find the recorded job state and error. A request being accepted or listed on the dashboard does not establish that the backup, certificate or other operation completed.
Understand account jobs →Account boundaries
Visibility for you. Policy with your provider.
Resource Center is a read-only view of your account. Your provider assigns the package and account overrides, maintains the server and decides which hosting tools are enabled.
If usage repeatedly approaches a limit, discuss the application and workload with the provider. A resource request is not an automatic plan purchase or an immediate change to the server.
Check the website itself when availability matters. Account summaries are useful context, but they are not an independent uptime check or historical performance report.
Frequently asked questions
Dashboard and resource questions.
Can I change my resource limits here?
Resource Center shows account usage and assigned limits. Your hosting provider controls package policy and account overrides; contact the provider about changes.
Is the CPU value a live percentage?
No. This view reports CPU time used since the account slice started, alongside its configured core allowance. It is not an instantaneous CPU percentage.
Does a dashboard summary prove my website is online?
No. Open the website and check the affected function. Account summaries and recent jobs provide context, not an independent uptime guarantee.
Does Resource Center show historical performance charts?
This workspace presents current readings, cumulative counters and assigned limits. Do not treat those values as a historical trend report.
Your hosting workspace