
Central Monitoring · Administrator workflow
Understand the incident.
Not just the alert.
Connect service checks, hosting-account impact and incident history in one investigation. Start with fresh evidence, establish what is affected, and keep the difference between recovery and resolution clear.
Check observation freshness before interpreting health.
Swipe to inspect · tap the image for full context
- Fresh observation
- Active incident
- Investigation
- Recovery and closure
Choose the right evidence
Five views. Five operational questions.
Use the overview to orient yourself, then move into the view that owns the detail. A summary counter cannot replace a service result or an incident record.
Overview
Where should I look first?
Compare server load, CPU, Apache worker use, memory and disk with active incidents and degraded accounts. Check the monitoring worker’s heartbeat and last full cycle before relying on the summary.
Services
Which component needs attention?
Read the component’s state, last check, last successful check, latency, failure count and evidence. Coverage notes distinguish an available signal from one that is incomplete or unavailable.
Accounts
Which customer workload is affected?
Compare HTTP response and resource use with effective account limits. The account view brings PHP workers, queue, CPU, RAM, processes, MySQL, Redis and disk into the same investigation.
Active Incidents
What still needs investigation?
Review active, acknowledged and recovering incidents. Open an incident to follow its evidence, recorded events, recovery attempts and notification history.
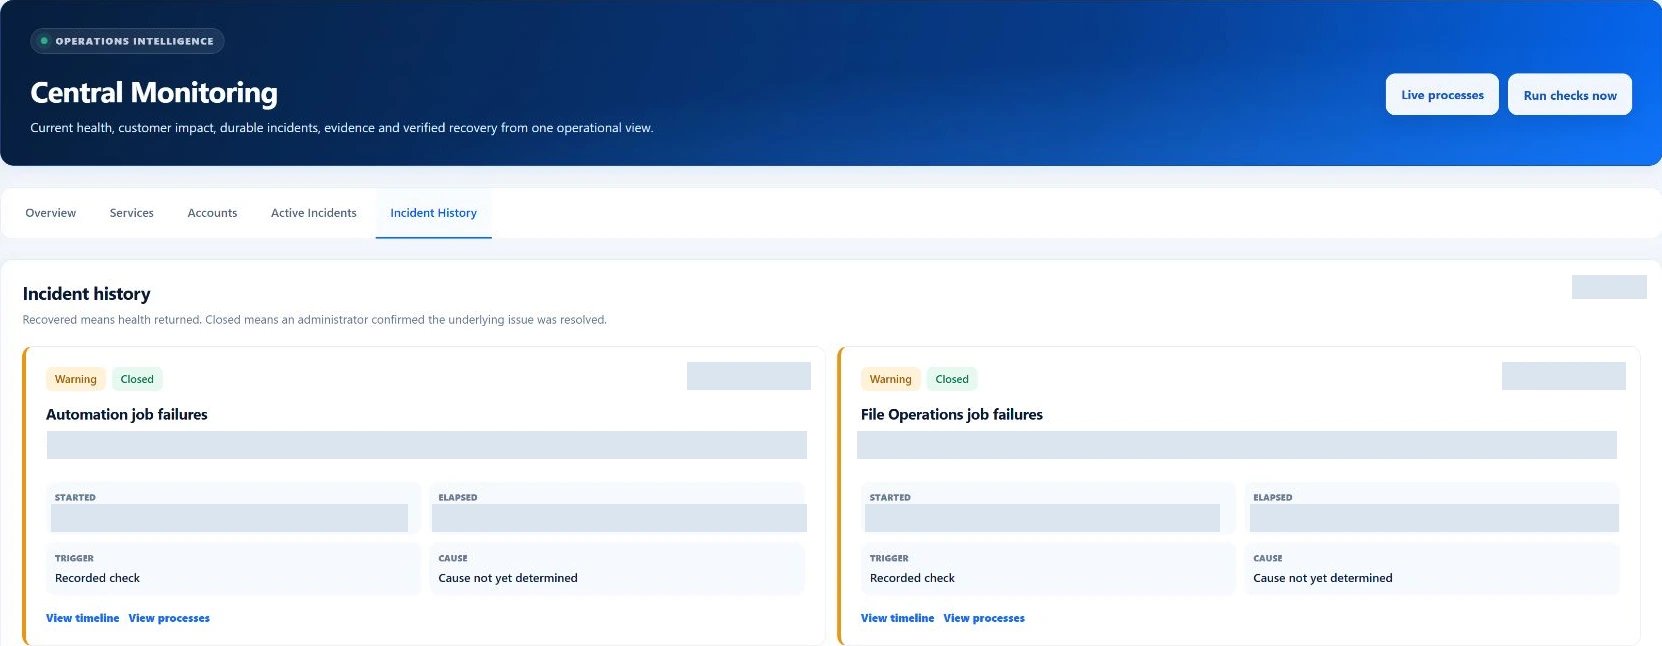
Incident History
What happened—and what was resolved?
Return to recovered and closed incidents. Recovery means health returned; closure records that an administrator has addressed the underlying issue. Those are deliberately different milestones.
Freshness before severity
“No active incidents” is not an all-clear.
A service may have no trustworthy observation even when no failure incident is open. Read the check state and worker timestamp together. Missing or stale data must not be interpreted as zero usage.
Healthy
The current check reports an acceptable result. Confirm that its evidence is recent enough to use.
Degraded
A check reports a warning or reduced health. Read the observed value and affected scope before choosing an action.
Critical
A check reports a failure or critical condition. The incident evidence helps identify the impact and investigation path.
Unknown
A reliable signal is unavailable. Investigate collection, configuration or freshness; do not assume the component is healthy.
The worker reports its last heartbeat, last full cycle, check totals and cycle duration. Service results also retain last-check and last-success times: an old success is not evidence of current health.
An incident is a record, not a badge
From first signal to a documented resolution.
Detect the abnormal signal
A monitoring cycle records checks and their evidence. A degraded or critical signal can open or update an incident, while successful routine checks remain in service and cycle records.
Establish impact and take ownership
Open the incident, inspect the affected service or account, and acknowledge it with context for the next operator. Acknowledgement records ownership; it does not repair the service.
Investigate before choosing a response
Use Server Health for workload investigation or Recovery Center to review eligible recovery actions. Monitoring connects the evidence; it does not give every incident an automatic repair.
Verify the return to health
Subsequent healthy evidence moves the incident to recovered. Review the recorded verification and any recovery attempts rather than treating an action request as proof of success.
Document the underlying resolution
A root administrator can close a recovered incident with a required closure note. Preserve what changed and why, so a recurring symptom can be investigated with its earlier context.
Customer context
See the account behind the symptom.
The Accounts view compares observed use with effective policy. That helps an operator distinguish a busy customer workload from a shared service problem without guessing from a package name.
- HTTP and response time
- Inspect the recorded response and latency for the account’s primary website. This is a local origin check, not a test from an external visitor’s network.
- PHP workers and queue
- Worker usage describes concurrency; queue evidence describes waiting work. A high queue and exhausted worker allowance raise a different question from high memory use.
- CPU, RAM and processes
- Compare consumption with the displayed effective limits. Where available, the source identifies an account override, package default or calculated server default.
- MySQL and Redis
- Review database connections and cache process, memory and client evidence when available. An unavailable cache measurement is not a zero-memory reading.
- Disk and account status
- Use disk consumption and the account’s health/resource state as context. Investigate in the owning module before assuming that changing a single limit resolves the incident.
Root administrator controls
Tune policy without hiding the evidence.
Thresholds with relationships
The policy form includes disk and load warning/critical percentages, failed-job counts and certificate-expiry warning/critical days. Validation checks their ordering: for example, critical disk use must exceed warning use, while a critical certificate window must be nearer expiry.
Choose thresholds for your host and workload. The defaults in software are not a sizing recommendation or a promise about your installed configuration.
Maintenance with context
Monitoring can be enabled or disabled. Maintenance settings include an active flag, an end time and a reason. During a maintenance window, administrator alert queuing is suppressed; the absence of a notification should not be treated as proof of health.
Keep the reason and intended end visible to other operators. Review fresh results after maintenance rather than relying on an earlier snapshot.
Notification evidence
Administrator email alerts are configurable. Incident records connect to notification jobs and their queued, sent or failed state. Recipient configuration and the notification worker are part of that path.
“Sent” records SMTP transport handoff—not guaranteed inbox delivery. Use the error and transport evidence when an alert does not arrive.
Know the operating boundary
Local checks are not external uptime monitoring.
The current account HTTP check routes the hostname to the local server and skips certificate trust verification. It helps diagnose the origin, but does not prove public DNS delegation, the route from a customer’s network or the public endpoint’s certificate trust.
Check coverage depends on the services and workers available on the host. The scheduler runs monitoring cycles and persists results; this is not a hard real-time stream or an uptime SLA. Review collection freshness before escalating or declaring an issue resolved.
Frequently asked questions
Does acknowledging an incident repair it?
No. It records administrator ownership and an optional note. Diagnosis, any eligible recovery action and verification are separate steps.
Why is an incident recovered but not closed?
Health has returned, but the underlying issue has not yet been marked resolved. Root can close the recovered incident with an explanation.
Can I request a fresh cycle?
The workspace has Run checks now. Review its result and timestamps afterward. Disabled monitoring or an already-running cycle can prevent a new cycle from executing; do not infer completion merely from clicking the button.
Does Monitoring replace Recovery Center?
No. Monitoring records checks and incidents. Recovery Center manages the eligibility and execution evidence for supported recovery actions. Not every incident has an automatic remedy.
What if an account metric is missing?
Check telemetry freshness and the relevant collector or service. The interface can show unavailable data; absence of an observation is not evidence that the account uses no resources.